Connecting Excel Tables
Hello Power BI fans, welcome to the second edition of this weekly newsletter! Since I’m committing on delivering these to you on a weekly basis, it’s become a good motivator for me to continue checking out the Power BI world (at least more than before) which I think is a positive thing for me! I found a few interesting things which I hope will be for you too, lets get started!
📢 Breaking News
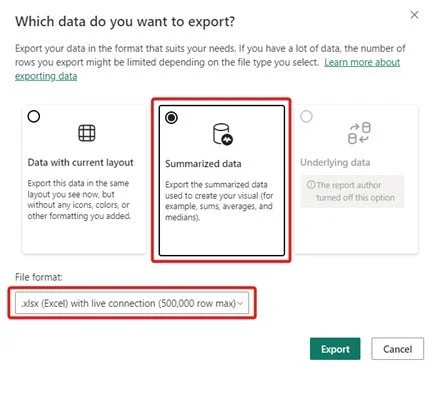
Did you know that you can now connect Excel tables with Power BI visuals? This news was announced last week in a blog post and essentially it allows you to Export Data with an additional option to export an Excel file with a live connection with Power BI.
Now you could do something similar to this before but it could only be done in the context of PivotTables via the Analyze in Excel feature. This allows you to get live data in a spreadsheet grid so you can actually use it for analysis!
Right off the bat, there are a few things I think this could be really helpful to me;
Live connection means if they need the same data again, I won’t have to provide it manually
Once the connection is set up, they don’t need to rely on me for data analysis (better for self service)
This feature supports up to 500K rows, which is an insane number
There’s a lot to unpack in this feature so I’ll try to cover it in a video
⚡ Report of the Week
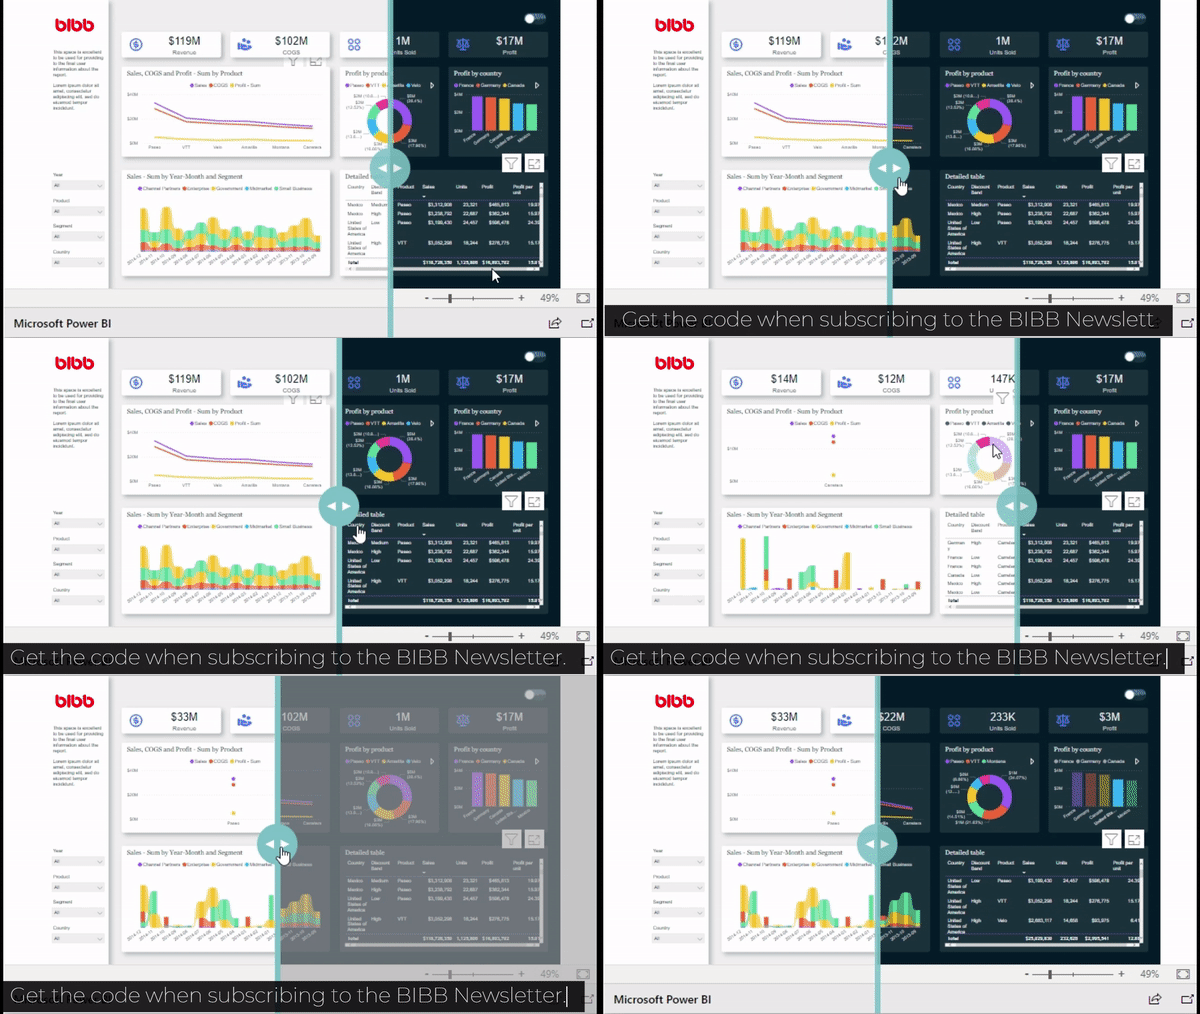
This week I want to introduce you to this report that I found created by Oscar Martinez Valero and his approach towards Light / Dark Mode really impressed me.
He’s written a post recently about it and in fact a few different approaches on how you can implement a way to toggle between light and dark mode.
But what caught my eye was this way of adding a slider to switch between dark and light mode! The implementation seems to be updating the iFrames codes you get when you embed your Power BI reports on the Service, but check out his post for the full tutorial on it!
📊 Other News
The Power BI team release a Feature Summary blog post on Datamarts, which is a Premium feature they released sometime ago which essentially allows you to clean and model your data in the cloud (more info here). Some of the updates include:
Updates to the Datamart Editor - You can now switch between previewing your data (Data View), write queries (Query View) and create measures and reports (Model View) easily
Takeover Ownership - Similar to Power BI datasets, you now have the option to take over ownerships of Datamarts
Connectivity to any SQL client - This allows third-party apps to connect to your Datamart outside of Power BI, making data available to more places!
🎥 Latest Videos from Us
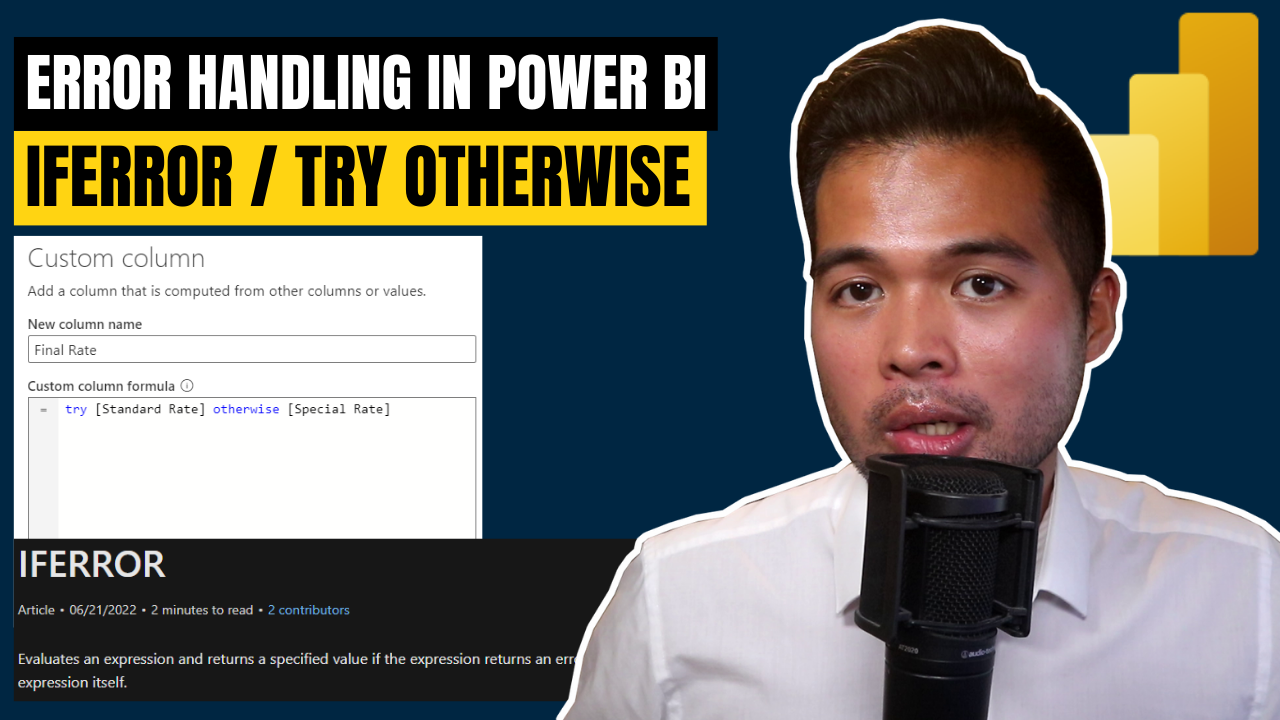
How to handle errors in DAX and Power Query
This video was all about error handling, which I admit isn’t the sexiest of subjects but important nonetheless. A work problem actually inspired me to cover this topic. While Power BI does a good job at handling most errors, some are just down right annoying because they can break your reports or automations quite easily with not a lot of clues where the bug is. Check it out if you’re interested!
Implementing a search bar in Power BI
Search bars are so useful, and there are so many ways you can implement them in your reports! This video is absolutely for beginners but I think that sometimes its good to revisit topics like this and go through the various options available. Watch it here
👀 Other Updates
New logo
If you haven’t noticed yet I’ve updated the Solutions Abroad logo across all of our social media accounts! So no more using the Power BI logo and instead will be using this one that I made.
And by the way, Artificial Intelligence helped me design this logo, which I will be covering very soon so stay tuned for that!
Updated Website
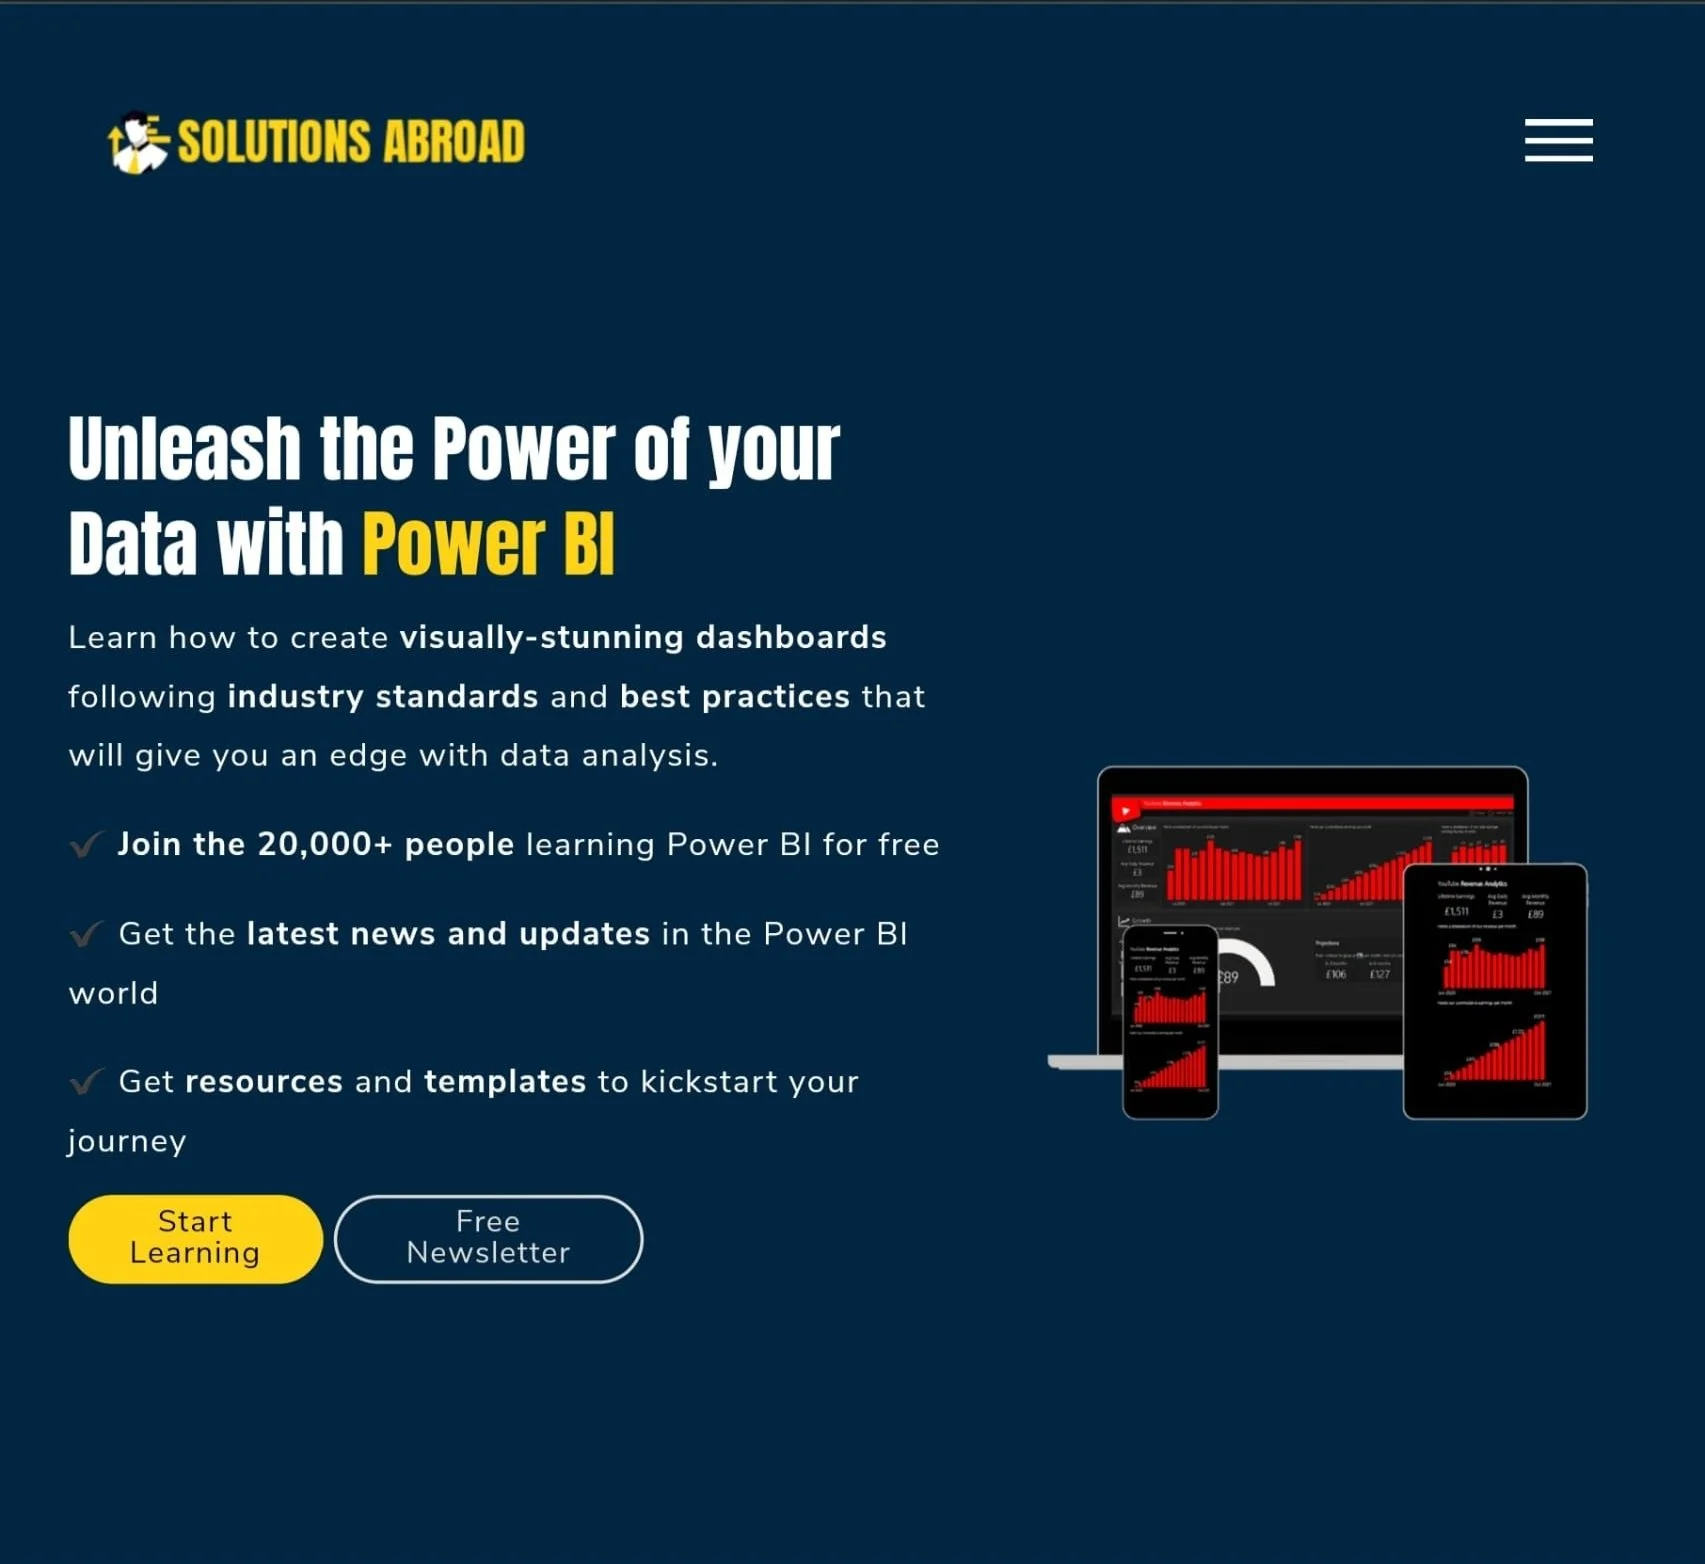
I’ve also spent some time to redesign the front page of the website, which I think does a better job at showing what solutions, products and services we provide.
💚 Enjoying these Weekly Newsletters?
Feel free to check out some of my other stuff, continue your learning or support however you can, thank you!
Subscribe to our YouTube Channel weekly learning (other socials below)
Get started with your data and Power BI journey with our Power BI Fundamentals Course.
Get Power BI Templates and other digital products from our online shop
Support us through Patreon or Ko-Fi, no obligations and you get some free stuff for it!
Finally and again, I want to thank you for supporting us and engaging what we do (or I do) here at Solutions Abroad. Have a great week ahead and see you again on the next one! ✌


