Paginated reports now available for PRO users
Hello Power BI fans 👋
I hope you’re all doing well and enjoying the Easter break, I know I am! I wrote this newsletter last week just before the break started so by now I hope to be in sunny Madrid eating calamares and drinking sangrias! Let’s get started with our report highlight this week!
⚡ Report of the Week
Have you seen this report made by Stefano Ciurlia?
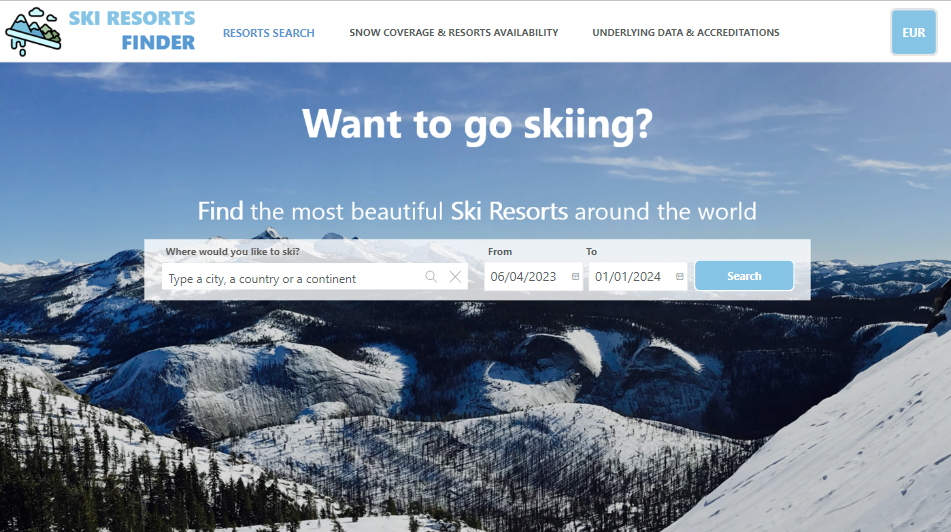
As I’ve become more engrossed with Power BI challenges, It’s prompted me to look at other winning entries and this one I stumbled onto is really special! It’s basically a Power BI report that helps skiiers find their ideal destination. The design gives a very Booking.com style and wow so many small details here and knowing how Power BI works, this must’ve taken a very long time to build. Here are the top features I liked from this dashboard;
The “search” style front page that mimics a booking website. Not just the search but the results as well give a very familiar feel to it, each resort has various information, with filter options, the typical options you’d normally have from a website
Reverse geo-coding which allowed him to get the resorts based on long and lat coordinates. He then used this data and combined it with season data to give a geo map view of the best regions to go to based on the month you want to go skiing
Live exchange rate API connection - I’ve covered before how you can convert currencies but this one just takes it to another level. He’s connected to a live API for free, and converts the currency data so you can see your costs in whatever home currency you have. It’s just amazing
As I said, so many techniques used here, some I don’t even know how he’s done it (i.e. search results) so I’m going to thoroughly dissect this and see what I can learn. If you’re serious about learning about Power BI design tricks, you should check this one out!
📰 News and Updates
I won the #DataDNA Challenge! … sort of - So a few weeks ago I submitted my very first entry to a Power BI challenge, it was a report to analyse Amazon Product Reviews for an iPhone. I spent almost a week obsessing over this report and I was pretty pleased with the final result. I won the “Storyteller” badge, but unfortunately not even a runner up. I was mildly disappointed but I did learn a lot along the way so I took that as a win. Hope we win something next time!
Paginated reports for PRO users - You can now create pixel perfect reports in the service! It’s a feature that I’ve not covered in the past because I never really had a Premium license to play around with it. Now this feature is available for everyone to use! So I’ll try to cover it in one of my videos so you can also learn about how to implement it for yourself! More info here.
Pin workspaces in Power BI - You can now pin workspaces, sort of like favourites so you can quickly access your most important workspaces!
🎥 New Videos from Us
Building responsive buttons - Creating app-like buttons that are responsive is very easy in Power BI, in this video I show you different ways you can do it in different types of buttons.
How to use shape maps - Shape maps is a visual that I don’t frequently use but is a very engaging way to visualise map-type visuals, and it’s not limited to just geographical maps, check out how!
Want more? Over at my Patreon page I have five new early access videos, some of the topics are pretty interesting (like how I built the Amazon Report) or how to use AI Insights like Sentiment Score. Consider supporting us, it costs about a cup of coffee to do so and you get these exclusive early access as a thank you from me!
That’s it for the update everyone, thank you for reading all my ramblings and see you all next week!
💚 Enjoying these Weekly Newsletters?
Feel free to check out some of my other stuff, continue your learning or support however you can, thank you!
Subscribe to our YouTube Channel weekly learning (other socials below)
Get started with your data and Power BI journey with our Power BI Fundamentals Course.
Get Power BI Templates and other digital products from our online shop
Support us through Patreon or Ko-Fi, no obligations and you get some free stuff for it!
Finally and again, I want to thank you for supporting us and engaging what we do (or I do) here at Solutions Abroad. Have a great week ahead and see you again on the next one! ✌

