Full Introduction to On Object Interaction
Hello Power BI fans 👋
Welcome to this week’s newsletter, hope you had a good Easter break! I’m seeing more and more sign ups from you guys and I’m really pleased about that. As a thank you, I wanted to give you early access to this video
It’s a video I created that fully covers every aspect of the Ob Object Interaction feature as it was when it released. I create a lot of my videos in advance to make sure that even when I’m on holiday, you guys still get your weekly learning. If you want to get early access to more videos, sign up to my Patreon, it costs less than a coffee and it really helps me out, thanks!
⚡ Report of the Week
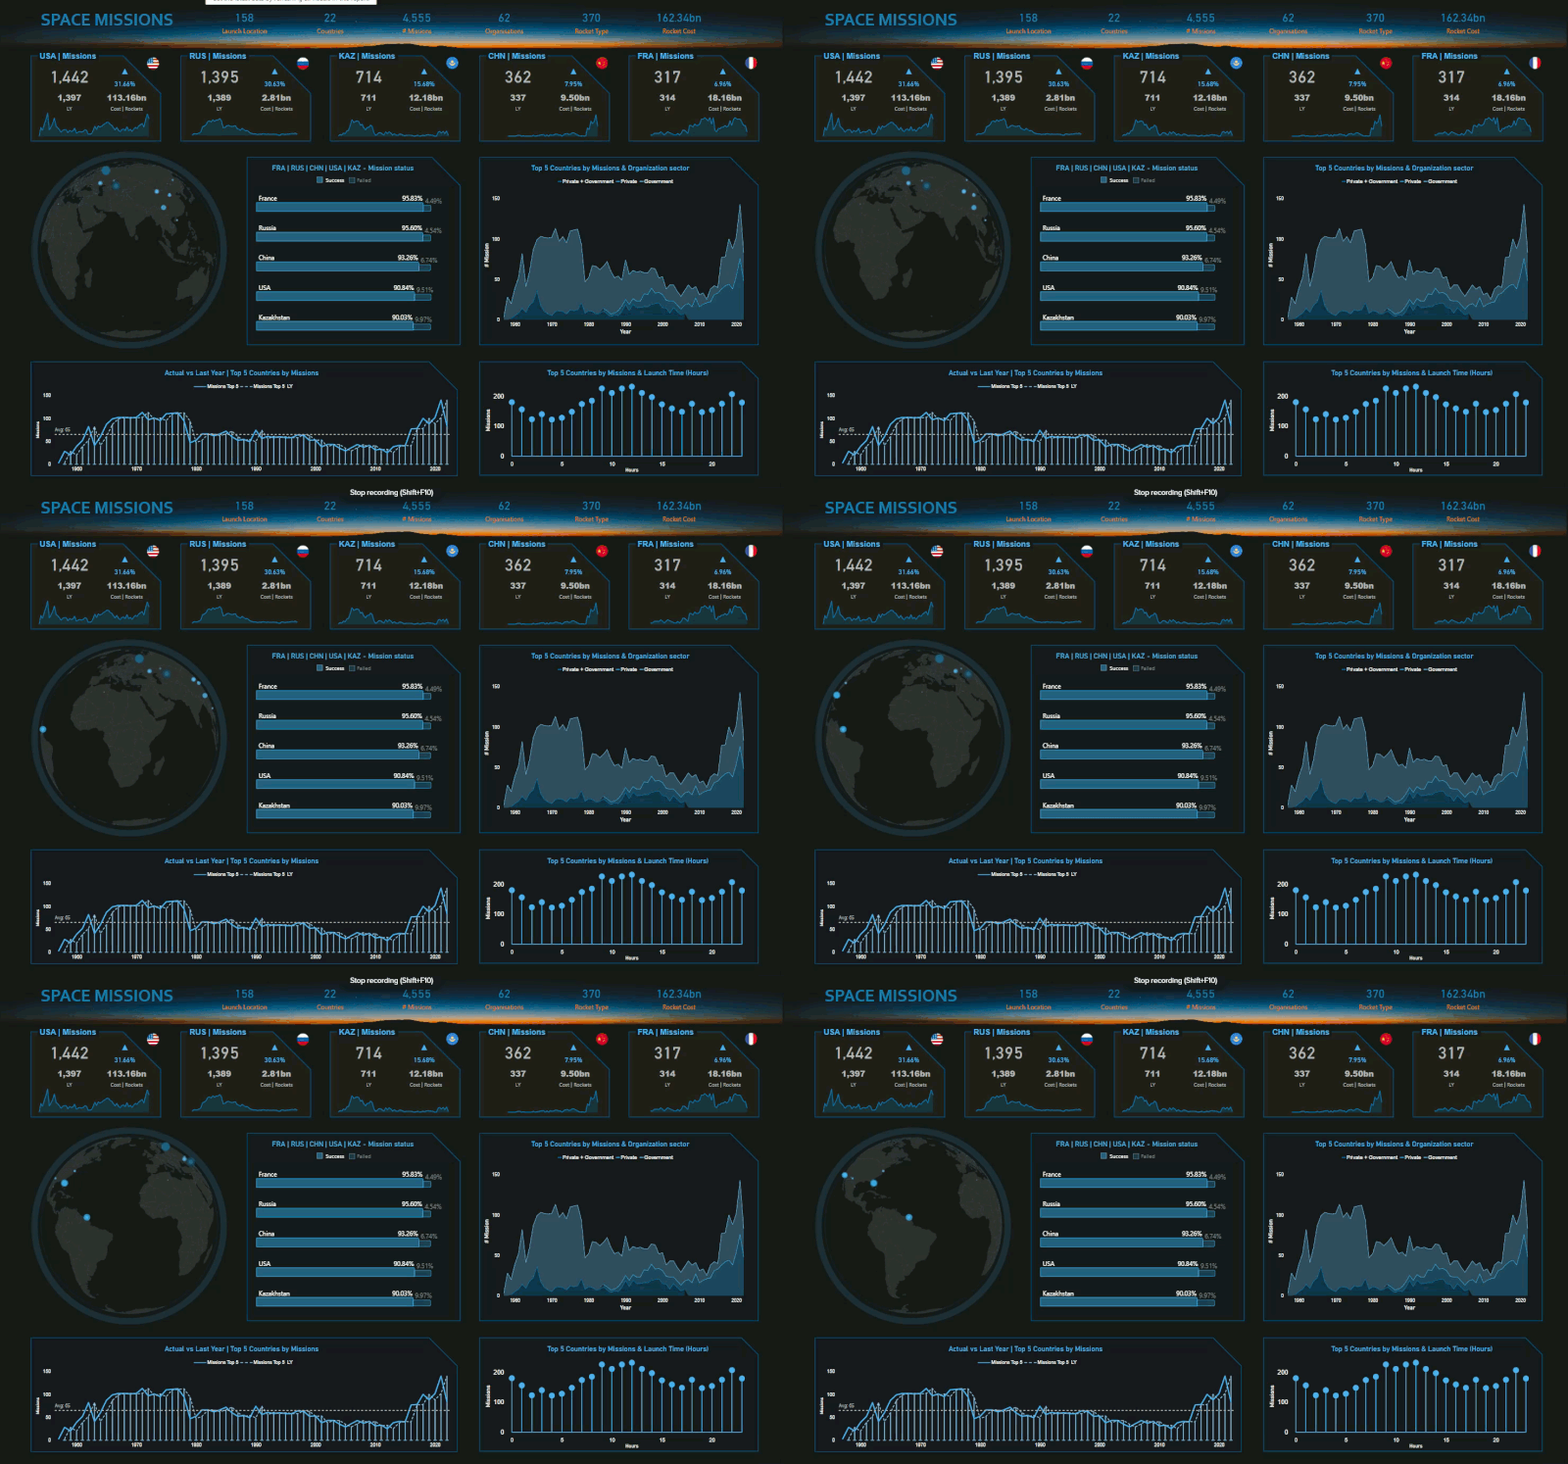
Have you seen this report by Zbigniew Porzych? It’s for a past challenge courtesy of FP20 Analytics. The report design is clean and unique (at least for me). The animated globe is a nice touch, which was created in Deneb with Vega. I’m starting to see more and more visuals with Deneb so if time allows, I will have a think about learning this and incorporating it in my next report!
📰 News and Updates
Power BI Best Practice Guidelines - Did you know that the Power BI CAT team publishes best practices guidance? I didn’t know, and finding out this exists is a game changer for me. Learning how to build reports is one thing, but building solutions at an Enterprise Level involves many things like data culture, DevOps, Migration, etc. and knowing that there is a collection of documents that exist which answers a lot of the FAQs is super helpful.
Edit Data Models on Power BI Service - This feature was released a couple of days ago and its an amazing feature that allows you to edit your models within the Power BI Service! Before this update, you’d typically Create and model your data sources in Power BI Desktop, then publish it to the Service to distribute. There is some capability for you to edit the visuals in your report pages, but at a limited capacity compared to Power BI Desktop. I assume this feature means that we might be moving to a future where Power BI desktop will no longer be needed? We’ll see!
Create stunning Power BI cover photos - Danil Zvyagintsev posted a really cool, easy to use trick that makes your cover photos look stunning. I’ve found needing to create something like for my community challenge submissions so if you want to know how, check out his post!
🎥 New Videos from Us
Dynamic Waterfall Chart - This video covers the basics of how to use this default visual, as well as how you can use field parameters to make its results dynamic.
How I Built the Amazon Reviews Report for the DataDNA Challenge - After participating my first community challenge, I’ve had lots of requests from people wanting to know how I built this report, this video covers every aspect from the thought process and niche tricks that I used to make the report work.
Optimize Ribbon - This video neatly rounds up all options available in this ribbon which helps you optimise the performance of your reports.
AI Insights - This video covers a Premium-Only AI features available in Power BI, I used it mainly for Sentiment Analysis but there are other cool things here like Image Tagging, Keyphrases, etc.
💚 Enjoying these Weekly Newsletters?
Feel free to check out some of my other stuff, continue your learning or support however you can, thank you!
Subscribe to our YouTube Channel weekly learning (other socials below)
Get started with your data and Power BI journey with our Power BI Fundamentals Course.
Get Power BI Templates and other digital products from our online shop
Support us through Patreon or Ko-Fi, no obligations and you get some free stuff for it!
Finally and again, I want to thank you for supporting us and engaging what we do (or I do) here at Solutions Abroad. Have a great week ahead and see you again on the next one! ✌

